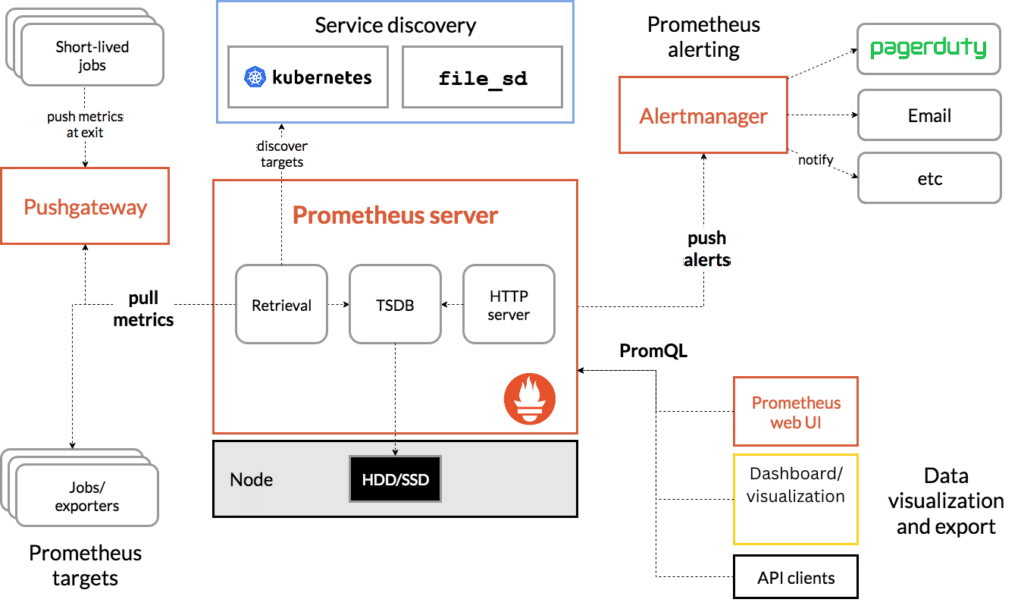
Prometheus Architecture Components
Prometheus Server:
-
Data Retrieval: Prometheus server periodically scrapes metrics from configured targets (e.g., application endpoints, node exporters). These targets expose metrics in a specific format over HTTP.
-
Data Storage: The scraped metrics are stored in a time-series database, optimized for fast writes and reads.
-
Query Engine: Prometheus uses a powerful query language called PromQL to retrieve and analyze time-series data. This query engine supports various functions for aggregating, transforming, and alerting on metrics.
Exporters:
-
Exporters are lightweight applications that collect metrics from a particular service or system and expose them in the Prometheus format. Examples include Node Exporter (for OS-level metrics), Blackbox Exporter (for probing endpoints), and application-specific exporters.
-
Exporters can be built-in to the applications themselves or run as sidecar containers or standalone processes.
Alertmanager:
-
Alertmanager handles alerts generated by the Prometheus server based on defined rules. It deduplicates, groups, and routes these alerts to various notification channels like email, Slack, or PagerDuty.
-
It also supports silencing alerts for maintenance periods and grouping related alerts to reduce noise.
Pushgateway:
- Pushgateway is used for short-lived batch jobs that cannot be scraped directly. It allows these jobs to push their metrics to Prometheus.
Service Discovery:
- Prometheus supports various service discovery mechanisms (e.g., Kubernetes, Consul, EC2, static configurations) to automatically discover targets. This makes it dynamic and adaptive to changing environments.
PromQL:
- Prometheus Query Language (PromQL) is a flexible and expressive query language used to retrieve and manipulate time-series data stored in Prometheus.